Background
One of the core engineering courses is the famous group-based design course where a bunch of real-world clients come with a problem. The fact we build something real and see its impact is very rewarding and its one of my favourite courses. The story is also really interesting so enjoy.
The problem
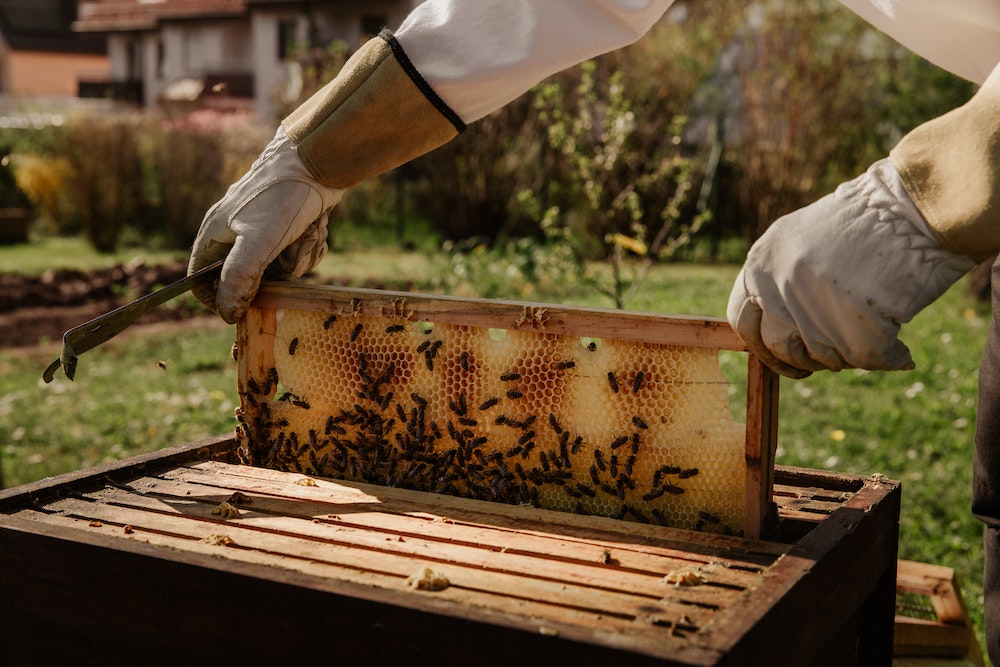
The client my team assigned to was the London Ontario Learning Apiary (LOLA Bees for short). LOLA came to us with a bunch of problems. The most concerning one was the huge loss of bees from the colony during winter. This was due a bunch of problems with the biggest two being excess moisture and / or starvation. Another thing to note is that a trip to the hive is also costly because its in the winter and the its better if the hive is not opened unless its needed.
From LOLA Bees: https://www.lolabees.ca/:

After a lot of “why"s and iteration on our problem statement, we figured out our need statement:
LOLA Bees needs a way to remotely monitor the temperature, humidity, and weight of their hives while optimizing spending to make it easier for beekeepers to manage the health of their hives
This way when the moisture levels fall off the range or the food needs to be re-filled, a trip can be made to the hive knowing its needed.
We also made a list of objectives and constraints in the order of most important to the client to least for us to test against:
Objectives
- Remotely monitor hives
- Maintenance and repair friendly
- User friendly experience
- Notify the user when values are above or below certain thresholds
Constraints
- Budget of approximately $50 per hive
- Electronics and hive must withstand winter temperatures
- Hive must be bee safe
Now that we settled that, we got to building 🏗️.
Building ≠ Proper Design
This course focused on a lot of design concepts, and one of them was that just building is not proper design. Building without design concepts leads to solutions that are forced and do not solve the root issue and rarely meet the needs of the client or the problem. Some concepts we were learned were:
- Constantly asking “Why” to get to the root of the issue and not force a solution over a problem that does not exist
- Granular testing and validation. This was done with constantly getting client feedback / validation as we design.
Market Research
After reaching our final stage of design iteration with the client, we did market research to compare the design against solutions already in the market:
Product comparing to:
- The Digital Beehive (Reference [5]): https://makezine.com/projects/bees-sensors-monitor-hive-health
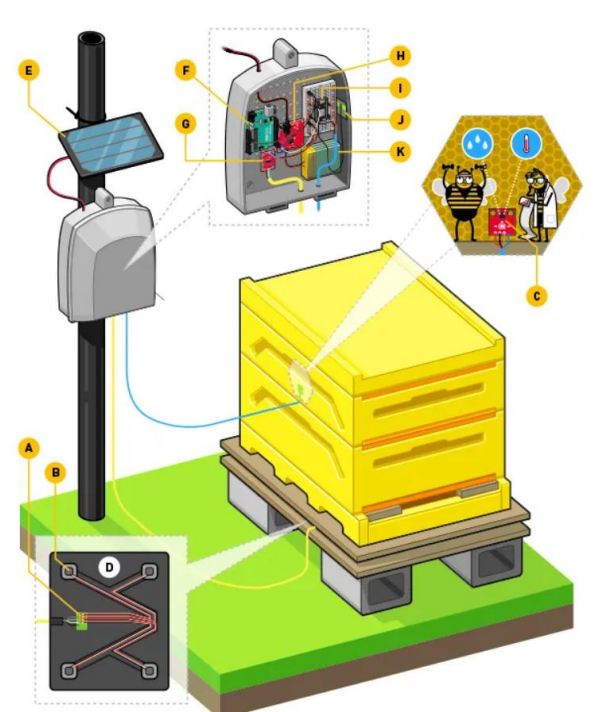
Practicality Comparison
- Our design is much more affordable, making it easier to deploy multiple units at once
- The Digital Beehive saves the data in graphs rather than a spreadsheet like our design, as the clients specified, they would like their information in a spreadsheet format
Strength Comparison
- The Digital Beehive has an organized compact enclosure to keep the electronics safe from the natural elements
- Our design is more reliable than the digital beehive as it continued to work after calibration and during testing whereas the digital beehive had their temperature and humidity sensor fail
- Our design is based off a team member’s current beehive monitoring system which has been active for years on end with no issue, this ensures a long-life span and effectiveness of our design
Weaknesses Comparison
- The alternative uses solar panels that are very inefficient and rely on a clear sky, which is highly unlikely on a Canadian winter day. They also cost a lot, which won’t meet the $50 per hive budget
- For our design, the clients will have to visit the hives regularly to access the data in winter, while they can access data more easily by using the alternative
My Contribution
Finally diving into some design decisions. To note, I was the computer person on the team, so I was tasked with choosing the components, making the circuit and programming the board, of course keeping in mind the objective and constraint lists we have made.
Choosing The Micro-controller
To read sensors and send them back to the client, we would obviously need some kind of computer. Our most notable choices are the following: We have CPUs which are what things like laptops have, we have ARM which things like the Raspberry Pi use, and then microcontrollers. We have a tight budget, so we should go for the smallest thing that allows us to meet needs. Our budget restricts us from using CPUs because of the power supply and board we need for them. This leaves us with Raspberry Pis but we don’t really need an OS to read sensors and send them back. This leaves us with microcontrollers that are typically cheap. Here I prioritised ease of developement because price would not differ a lot in this category. The option I settled with is a 7 dollar ESP32-microcontroller. It had WIFI and Bluetooth and supports the very friendly Arduino programming platform.
Choosing the other components
Then in terms of sensors, we first need to read temperature. I needed a sensor that outputs a voltage range that the ESP32 can read (AKA a 5V kind of setup) and also survives the winter. This left me with a couple options but I chose the one with the most library support (to decrease developer time); the DHT11 sensor.
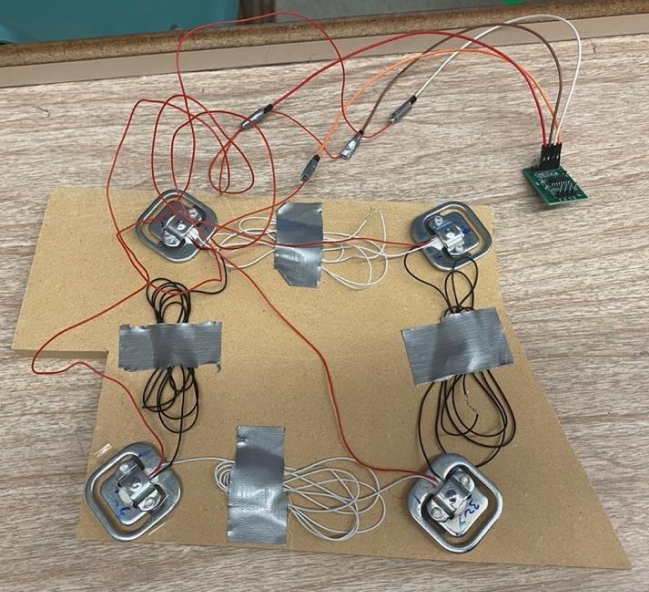
The other sensor I needed was weight. For this one, most options were outside our budget. This left me researching how cheap scales measure weight. The setup they used was 4 aluminum “load cells” as they call it, which are just metal that changes current output as it deformes, on 4 corners of a platform that all connect. The changes in voltage are also little so we need a small amplifier that outputs a 1 to 5V range that the ESP32 can work with.
Here is how that looks like:
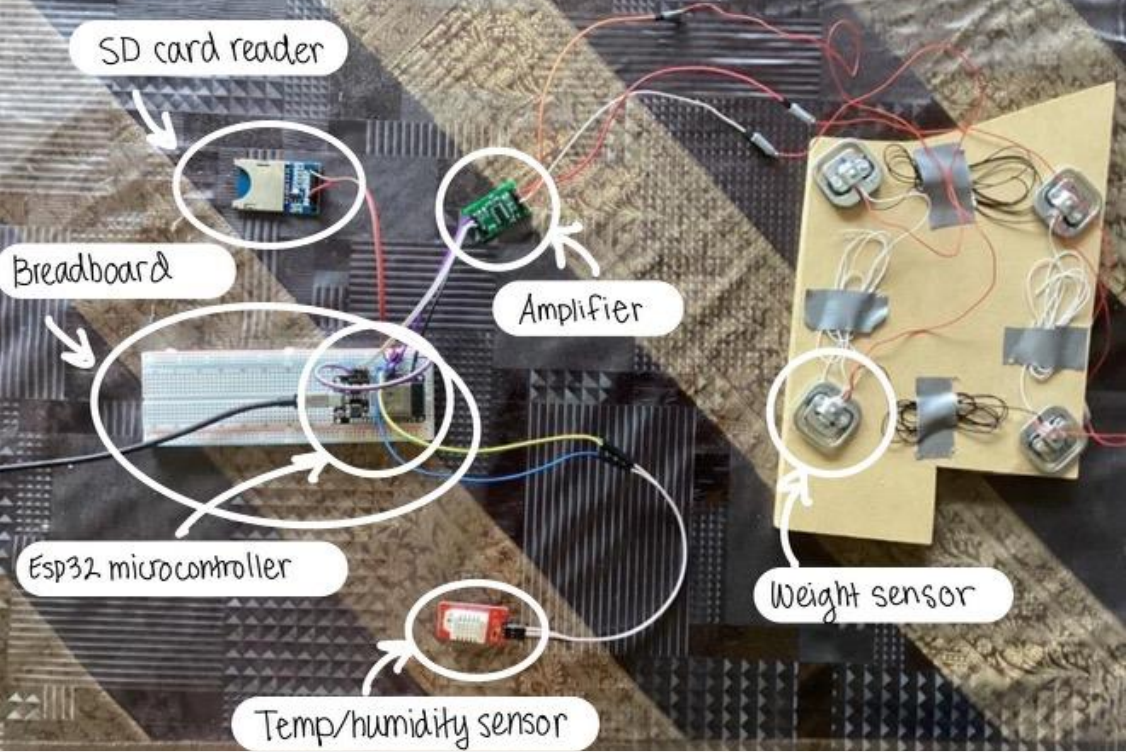
Final Circuit
And here is how the final circuit looks like this:
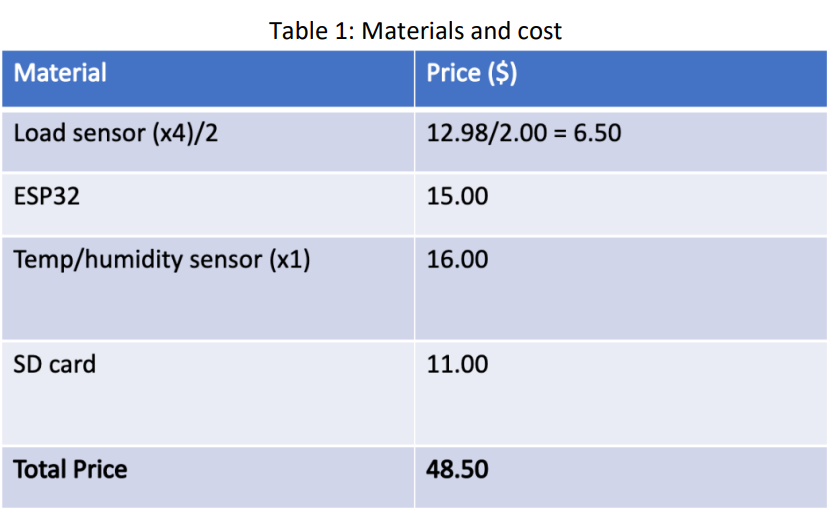
This leaves us with a budget table that looks like this:
Software Design
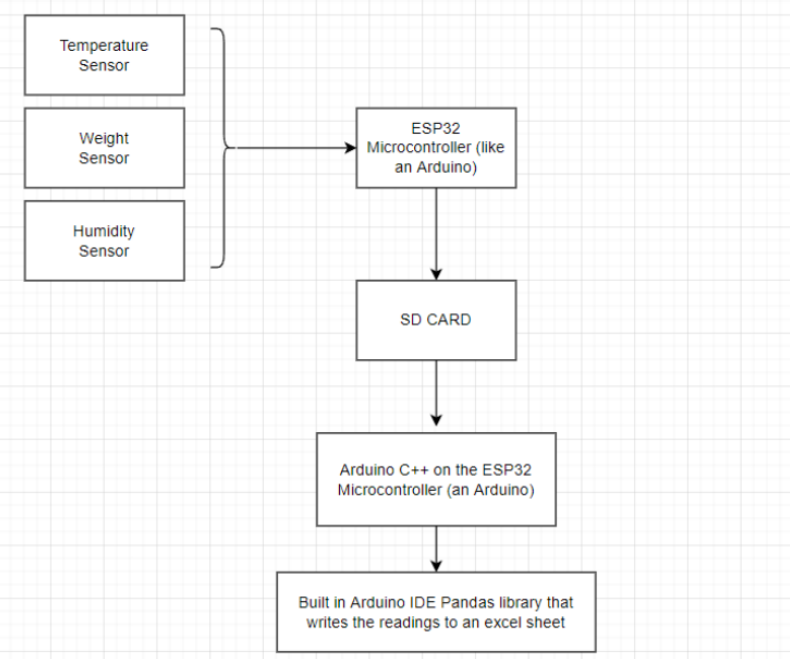
In terms of software, there was two parts to this. The software running on the microcontroller taking sensor data and sending it, and the web server that receives this data and graphs it for LOLA bees to view / notifies them.
For software running on the controller, a finite state machine is usually made, but I did not need very specific state tables or digital logic so I just made a flowchart:
For communication, I used POST calls to a Node.JS server that runs InfluxDB. I chose Node.JS because I was familiar with it, and InfluxDB because its built for time-series data from sensor for example and it makes queries for high cardinality data fast.
Other Learnings
Other than the design concepts and countless other things, something that stands out is how the client doesn’t really know what they want and you had to really prepare questions to get to the root of the problem. Not to imply its the clients fault because its our job after all.
In the end, it was really rewarding seeing how real impact our project created, very cool🧙.
Links
Source Code: https://github.com/HikaruSadashi/1050-winter-project
📝Full Report PDF: https://khalidzabalawi.ca/beereport.pdf